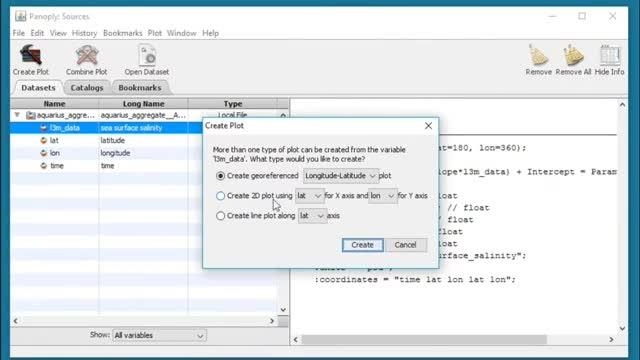
This video demonstrates how to make a longitude-latitude plot in Panoply. This tutorial assumes that you have already installed Panoply and have a netCDF file open that you wish to visualize.
About Panoply: Panoply is a cross-platform application that runs on Macintosh, Windows, Linux and other desktop computers and allows users to plot geo-referenced and other arrayed data that are in netCDF, HDF, GRIB, and other data formats.
Link to printable step-by-step for this video: https://earthdata.nasa.gov/files/06LatLonPlotVisualizingaDatasetUsingPanoply.pdf
For more information about Panoply , http://www.giss.nasa.gov/tools/panoply/
*See Panoply Orientation video for download instructions/Panoply orientatation